A simple guide to microdata.no
To get started with microdata.no, we will show how to create a typical statistic through some of the most basic commands in the tool. Our statistics example shows the average income in Oslo, Bergen and Trondheim, and the gender distribution of the average income in these municipalities.
Average income in Oslo, Bergen and Trondheim
Average income in Oslo by gender
Average income in Bergen by gender
Average income in Trondheim by gender
Below, we will go through all the steps needed to create such statistics step by step.
Create a connection to the datastore
require no.ssb.fdb:38 as db
The first command used is require, which connects to SSB’s database where all variables are stored. It is referenced as db in the script and is necessary to access the required data.
Datastore version
The last number in no.ssb.fdb:38 represents the version number. The latest version contains the newest updates to variables and years. You will be notified if you are using an older version than the latest one:

Creating a dataset
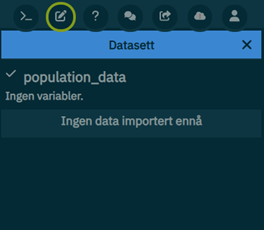
create-dataset population_data
This command creates a new, empty dataset with the optional name population_data. The dataset also appears on the right side of the window after the command is executed. To populate the dataset with content, you can import variables from the database using the import-command. This allows you to retrieve the desired data into your new dataset.
First imported variable
import db/INNTEKT_WLONN 2022-12-31 as income22
This command imports the variable INNTEKT_WLONN from the database as of December 31, 2022, and assigns it the name income22, representing individuals’ wage income for 2022. It also appears in the dataset on the right side after execution.

This is the first variable imported, which means it defines the population in the dataset. The dataset includes only those who had wage income in 2022. This variable has the temporality type accumulated, meaning that the dates represent annual income as of the last day of the year (31.12.xxxx). You can choose any date within the relevant year if you have accumulated values measured over a year. The values obtained will be the same (accumulated annual value).
After importing the first variable, the dataset looks like this (illustration):
| personID | income22 |
|---|---|
| 1 | 450 000 |
| 2 | 320 000 |
| 3 | 150 000 |
| 4 | 700 000 |
Second imported variable
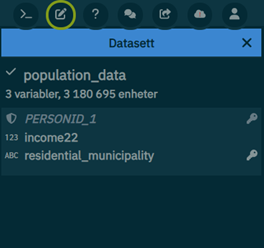
import db/BEFOLKNING_KOMMNR_FORMELL 2023-01-01 as residential_municipality
After the income variable, a variable indicating individuals' residential municipalities is imported. This command imports the variable BEFOLKNING_KOMMNR_FORMELL as of January 1st, 2023. It includes all individuals officially registered as residents on that date. This variable has the temporality type cross-sectional, meaning that all individuals registered as residents in a municipality in the population register as of 1.1.xxxx are included. Variables with this type of temporality will typically be measured over fixed recurring dates, in this case 1/1 every year. If you choose another date, you will not receive any information.
How importing new variables affects the existing dataset.
When importing new variables into your dataset, all rows from the existing dataset are retained (all those with a value for income22, the first imported variable). The new variables are added based on matching rows between the existing dataset and the newly imported data.
For example, if you first import the variable income22 (income for 2022) and then import residential_municipality (residential municipality), the residential information will be added for all individuals who already have a value for income22. This method is called a left join. After importing residential_municipality, the dataset looks like this (illustration):
| personID | income22 | residential_municipality |
|---|---|---|
| 1 | 450 000 | "0301" (Oslo) |
| 2 | 320 000 | "4601" (Bergen) |
| 3 | 150 000 | "0301" (Oslo) |
| 4 | 700 000 | "5001" (Trondheim) |
Filtering
Since this example focuses on average income distribution in Oslo, Bergen, and Trondheim, we can filter the dataset to retain only these municipalities. We use the keep if command and specify the municipality codes separated by | (or). The numerical codes can be found in the variable description. The variable is alphanumeric, so quotation marks must be used when specifying values.
It is also possible to use a filter directly in the statistics command by adding an if condition at the end (but before any options you may enter after a comma). Thus, you avoid using such a `keep if' command.
keep if residential_municipality == "0301" | residential_municipality == "4601" | residential_municipality == "5001"
After running this command, the dataset includes only residents registered in Oslo, Bergen, and Trondheim 1st of January 2023, and all other municipalities are removed.
Analysis
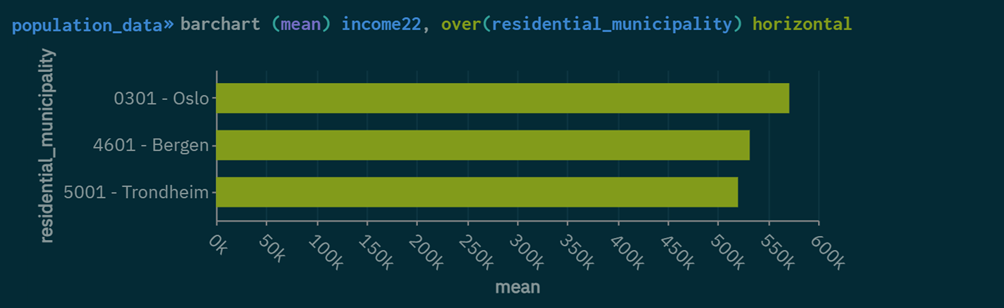
To calculate the average income in Oslo, Bergen, and Trondheim, we can use the barchart command with the variables income22 and residential_municipality. This command generates a barchart showing the average income for residents in the specified municipalities.
barchart (mean) income22, over(residential_municipality) horizontal
barchart(mean) income22 specifies that we want to create a barchart showing the average value (mean) of the variable income22.
over(residential_municipality) groups the data by municipality so that the average income is calculated separately for each specified municipality.
horizontal specifies that the barchart should be horizontal. Without this option, the chart would be vertical by default.
The commmand produces this result:
Built-in help function
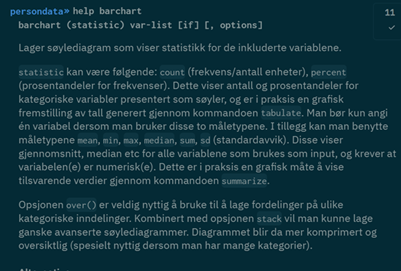
The help command provides detailed information about commands and their usage. For example, by typing help barchart, you get an explanation of how the barchart command works, including syntax and examples.
help barchart produces this result:
Importing additional Variables
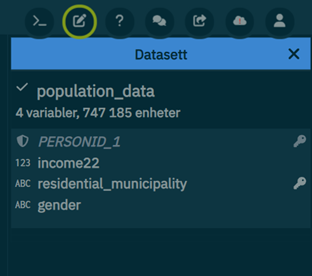
import db/BEFOLKNING_KJOENN as gender
If you want to import additional variables, you can do so at any time in the script. To analyze the gender distribution of average income in municipalities, we can import the gender variable and include it in the analysis.
The variable gender has the value "1" for male and "2" for female. This variable has the temporality type fixed, meaning that it does not change over time, and therefore, no date specification is needed. The variable appears in the dataset on the right side of the window after execution.
After importing gender, the dataset looks like this (illustration):
| personID | income22 | residential_municipality | gender |
|---|---|---|---|
| 1 | 450 000 | "0301" (Oslo) | "2" (Female) |
| 2 | 320 000 | "4601" (Bergen) | "1" (Male) |
| 3 | 150 000 | "0301" (Oslo) | "1" (Male) |
| 4 | 700 000 | "5001" (Trondheim) | "2" (Female) |
Average income in Oslo, Bergen and Trondheim by gender
The barchart command is used to create a barchart per municipality, separated by gender.
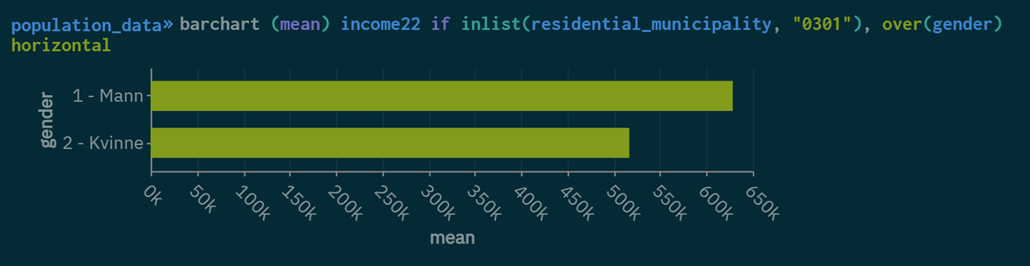
Average income in Oslo by gender
barchart (mean) income22 if inlist(residential_municipality, "0301"), over(gender) horizontal
inlist(): This condition filters the data so that only observations from the specified municipality are included in the analysis.
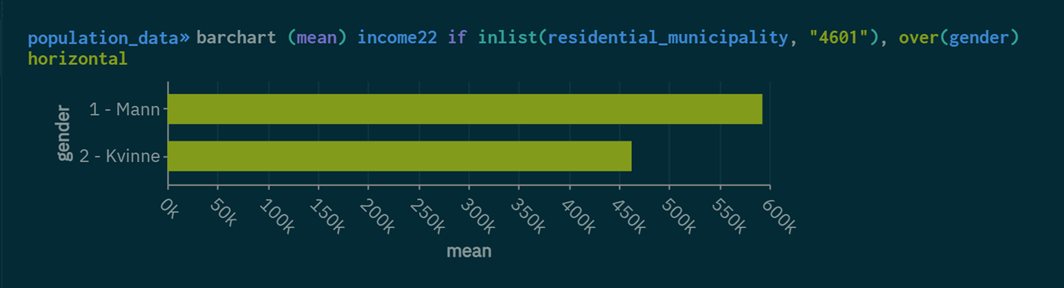
Average income in Bergen by gender
barchart (mean) income22 if inlist(residential_municipality, "4601"), over(gender) horizontal
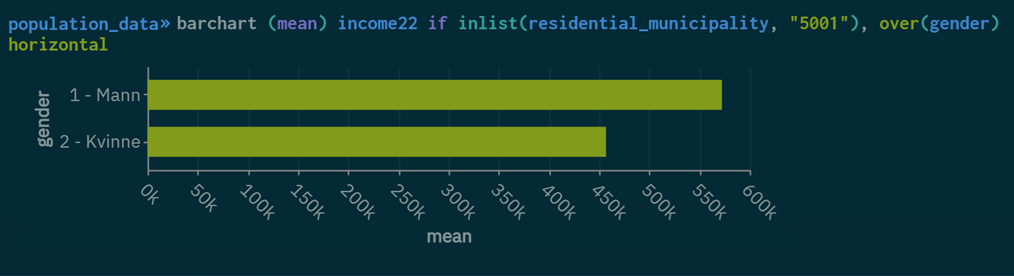
Average income in Trondheim by gender
barchart (mean) income22 if inlist(residential_municipality, "5001"), over(gender) horizontal
Complete script
 require no.ssb.fdb:38 as db
create-dataset population_data

import db/INNTEKT_WLONN 2022-12-31 as income22
import db/BEFOLKNING_KOMMNR_FORMELL 2023-01-01 as residential_municipality
//Oslo, Bergen and Trondheim filter
keep if residential_municipality == "0301" | residential_municipality == "4601" | residential_municipality ==  "5001"

//Average income in Oslo, Bergen and Trondheim
barchart (mean) income22, over(residential_municipality) horizontal
help barchart

import db/BEFOLKNING_KJOENN as gender
barchart (mean) income22 if inlist(residential_municipality, "0301"), over(gender) horizontal
barchart (mean) income22 if inlist(residential_municipality, "4601"), over(gender) horizontal
barchart (mean) income22 if inlist(residential_municipality, "5001"), over(gender) horizontal