4.6 Hexbin - anonymized scatterplot
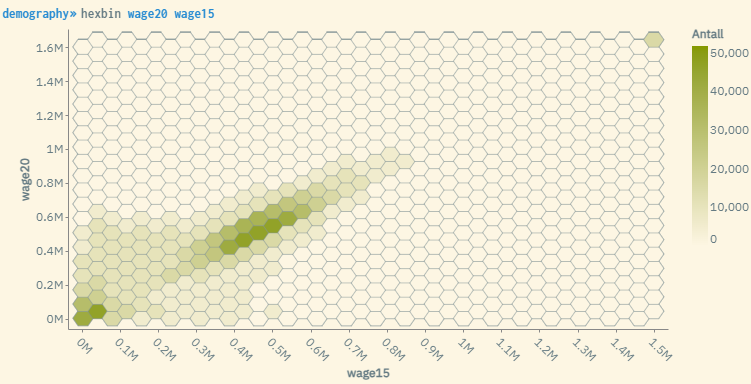
Hexbin diagrams are basically anonymized scatterplots where thetwo-dimensional area is divided into a given number of hexagons. The colour of each hexagon represents the density of observations in the specific interval of x- and y-values. The darker the colour, the more observations are observed in this particular area.
Hexbin diagrams produce a graphical presentation of the distribution of units between two continuous variables, and are not suitable for categorical variables.
By holding the mouse cursor over the various areas in the diagram, the corresponding values will be shown.
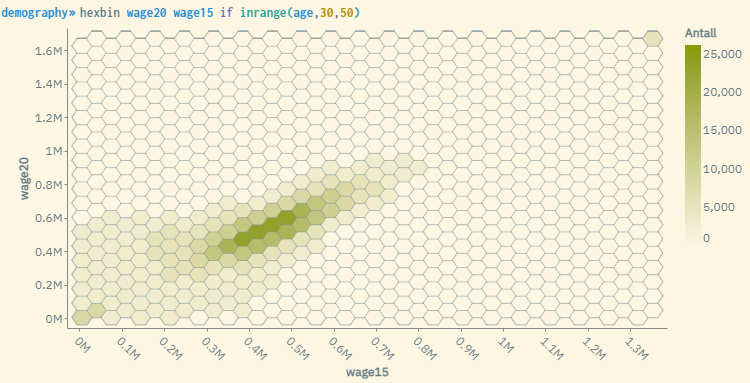
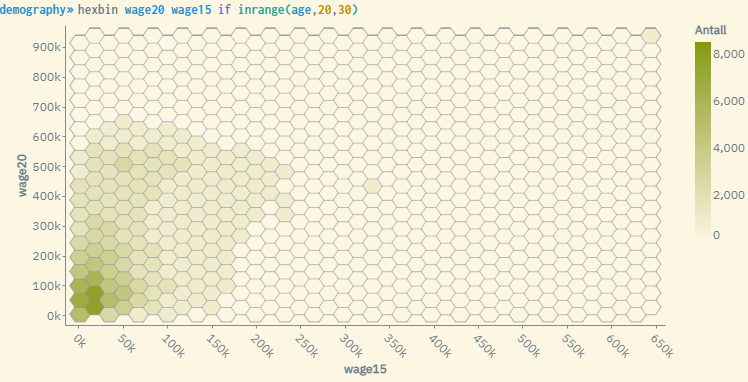
Like other statistical presentations, if-conditions may be used in combination with the hexbin-expression to show diagrams for sub-populations. Also, the number of hexagons and intervals may be customized through options.
For more information about this command, use the help hexbin command. This will display syntax examples and a complete list of available options that can be used to customize the appearance of the statistics generated.
Examples:


By using the gridsize(25) option, you will get a more detailed display of the hexagons (sets the number of hexagons to the maximum value). The default choice is set to 20 if the option is not used. The resolution then becomes slightly coarser.
The groups() option can be used to determine the number of color shades. groups(10) is the maximum and is used by default.