4.2 Summarize and boxplot - metrical statistics
The commands summarize and boxplot are tools for generating summary statistics for metrical/continuous variables. Like other statistical commands in microdata.no, if-conditions may be used to generate statistics for sub-populations (trimming of population in advance is not necessary).
Examples are presented below, showing summary statistics for the variables income and wealth measured per 2019 and 2018 respectively, where the population is all residents between the ages 16-66.
The summarize command displays key statistics for the specified numeric variables:
-
Average
-
Standard deviation
-
Number of units with valid value
-
First percentage value (upper limit value)
-
Internal quartile values (50% = median value)
-
Last percentage value (lower limit value)
It is also possible to display gini coefficient values as well as
interquartile values (range between 75th and 25th percentiles) by using resp. the options gini and iqr.
The command boxplot shows a graphical presentation using a standard boxplot (a box representing the two middle quartiles, plus mean, minimum, and maximum values).
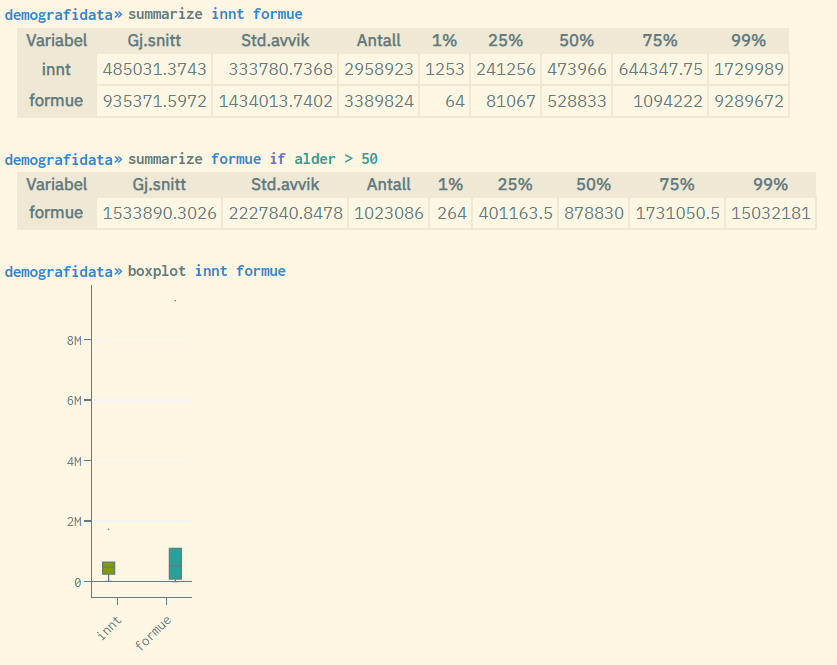
By holding the mouse cursor over the various boxplot areas, the corresponding values will be shown.
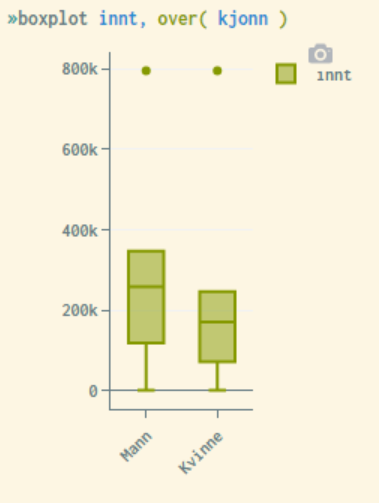
The command boxplot gives the opportunity to show separate figures for specified categories represented by a custom variable:
boxplot variable1, over(variable2)
Example of boxplot measuring income per 2000-01-01 by gender:
The values for mean, standard deviation and gini are affected by the fact that the statistical population is winsorized before the figures are calculated. Winsorization means that one codes extreme values and sets them to the limit value for the respective first and last percentile, cf. the values for 1% and 99% in the summarize result. This affects the average, standard deviation and gini so that the calculated value is somewhat lower than the actual value. This depends on how skewed the distribution for the respective variable populations is. In the case of a normal distribution, winsorisation will not have any particular effect.
Percentile, quartile, and median values are not affected by winsorization, but are displayed with three-digit precision.
Graphical displays of numerical calculations through commands such as boxplot, barchart, histogram and hexbin are also affected by the mentioned privacy measures.
Regression analyzes mainly return estimates and to a small extent personally identifiable information. Therefore, these are not subject to the measures mentioned above. You will find documentation of available regression analyzes in chapter 5.
More information about winsorization and other privacy measures can be found here
For more information about these commands, use the help summarize or help boxplot command. This will display syntax examples and a complete list of available options that can be used to customize the appearance of the statistics generated. For example. the gini option can be used to display gini coefficient values in addition to the standard summarize result.